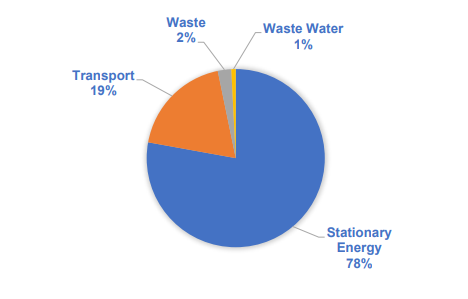
The Wollongong Local Government Area emissions profile (2016-2017) is made up of:
- Stationary energy 78% - this involves mainly electricity consumed by residential, commercial and institutional facilities, and manufacturing and construction activities.
- Transport 19%
- Waste 2%
- Waste water 1%